![High Performance MySQL [Ch.3: Profiling Server Performance]](https://cdn.hashnode.com/res/hashnode/image/upload/v1618605030745/WryvXTd-w.png?w=1600&h=840&fit=crop&crop=entropy&auto=compress,format&format=webp)


So in the previous article we talked about chapter 2 of High Performance MySQL which discussed MySQL Benchmarking, this article discusses chapter 3 which discusses Profiling Server Performance.
Before starting a discussion on the internals of MySQL or any optimization techniques, it's essential to learn how to benchmark a server performance and how to profile for performance bottlenecks. Chapter 3 gives a good introduction on profiling MySQL queries and diagnosing intermittent problems.
Profiling Server Performance
As the book authors say, profiling server performance is a way to answer the most three common questions asked pertaining to a database server performance which are:
- Finding out if the server is doing its work optimally.
- Finding out why a certain query takes so much time.
- Troubleshooting intermittent problems that might appear as stalls or temporary system freezes happening sporadically.
The book defines optimization as reducing response time, so naturally, it makes sense to be able to understand why exactly the server needs a certain amount of time to respond to a query in as detailed way as possible. This will enable us to know if the server is doing work that can be eliminated by maybe re-writing the query, adding an index, etc. or it can tell us that everything that server is doing is actually necessary and that it's best we can do which saves us a lot of time before we start optimizing something that's already at its maximum speed.
Another important rule the book mentions is to carefully pick your battles, that is to say, you need to learn how to decide on which queries to optimize and which to not. So for example, if a query only runs 5% of the time, any performance improvements however significant will at most improve the overall performance by 5% so other minor improvements in queries that run 50% of the time will be more worthy of our time.
What is Profiling?
Profiling a task is not as simple as measuring how much time a task takes to conclude, rather it requires measuring how much time the task takes broken down to individual child tasks that it needs to execute. This structure is useful to construct call graphs and understand what the server actually does to execute a query. It's also useful to be able to aggregate similar tasks in single items and sort tasks so that the important ones bubble up.
To make this clearer, let's take a look at a simplified profile produced for a SELECT query against a table called InvitesNew:
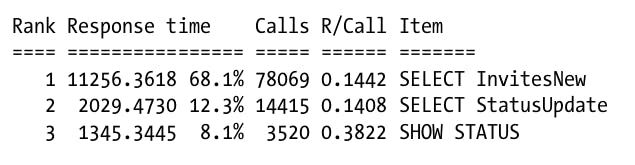
The able above shows a subset of the columns the profile would normally have for clarity. The first column shows the rank which is an indication of how important a task is (importance here is defined as its response time percentage of the total response time of all tasks), the second column is the aggregation of response time of all instances of a certain task, the third column shows the percentage of time all instances of this task take compared to the total execution time which determines its rank, the fourth column shows the number of instances of this task, the sixth column shows the average response time for each instance of the task and the sevenths column shows the task itself.
There are two types of profiling, execution time profiling which is useful if tasks are CPU bound, those types of queries would spend the majority of their execution time doing work. The other type which is wait analysis is useful for I/O bound queries that spend the majority of its execution time waiting to access resources or read/write data.
Instrumentation
All the previous only considered profiling queries on the MySQL level. In many cases, profiling the application might be easier and more useful as it might show problems early. Instrumentation is having a profiling active in every operation the application is performing. The book mentions a tool called Newrelic which is a great tool for profiling a web server as it shows the response time of each endpoint broken down to some finer grained tasks. This type of profiling can help figure out if an endpoint is slow because of a database query or because of something else which is quite useful before jumping ahead and profiling the database itself. This also let's you know if you need to optimize anything at all and which queries are more worthy of your time.
If you are looking to profile a mobile application, make sure to check Instabug APM as it enables you to create custom traces around operations that you think are worth measuring among a load of other useful features. You can read more about it here.
Profiling MySQL Queries
Profiling MySQL queries can be done on two levels:
- Profiling the Server's Workload: This approach is useful if the application has no instrumentation in place so you actually don't know what queries to optimize. This helps to identify those trouble spots that need optimizing. MySQL has something called a
slow_query_logwhich logs slow queries (slower than a certain threshold) which can be inspected and it's controlled by a variable calledlong_query_timewhich can be set to zero to log all queries on the server that can later be used to create a profile for the server. It's worth noting that logging queries incurs extra I/O cost that according to the authors is negligible for I/O bound workloads but noticeable for CPU bound workloads. Also logging all queries onto the server might eat up disk space quickly, so you would have to have a mechanism in place to regularly clean up those logs. There are lots third party that do a pretty good job at this. - Profiling a Single Query: If you already have instrumentation in the application or you did a whole server profile before, you probably have a list of queries that are troublesome and need optimizing. But in order to optimize that individual query, you need to understand why it takes a certain amount of time and doing which tasks. MySQL has a really useful command called
SHOW PROFILEwhich is used to profile certain queries. To enable profiling, you need to set the variable profiling to 1, then you can start issuing queries to the server that you can later use the commandSHOW PROFILESto see all recorded profiles andSHOW PROFILE FOR QUERY <id>to check the profile for a certain query.
Single Query Profiling Example
The book show an example of how useful a basic command such as SHOW PROFILE can be used. After performing SET profiling=1; to enable profiling, we issue the following query:
SELECT * FROM lists;
Then if we run SHOW PROFILES, we get a list of all the available query profiles which is only 1 in this case because we only ran 1 query. The output of which looks like this:
+----------+-------------+---------------------+
| Query_ID |  Duration   |        Query        |
+----------+-------------+---------------------+
|        1 | 0.16767900  | SELECT * FROM lists |
+----------+-------------+---------------------+
We can then inspect the profile of query withID=1 by running SHOW PROFILE FOR QUERY 1; which produces a detailed table of all the operations it needed to execute. A truncated version of this table is shown below:
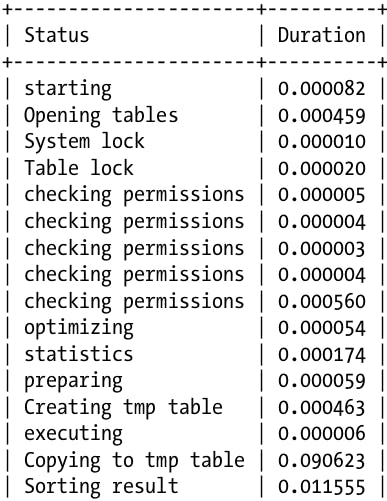
The problem with the raw output we get is that it has repeated tasks, like for example 5 tasks for checking permissions which clutters the output and makes it difficult to process. However, we can perform normal SQL queries on the profiling table as we do on any other table to format it in whichever way we wish, like for example:
SELECT STATE, SUM(DURATION) AS Total_R,
ROUND(
  100 * SUM(DURATION) /
  (SELECT SUM(DURATION)
   FROM INFORMATION_SCHEMA.PROFILING
   WHERE QUERY_ID = @query_id
),2) AS Pct_R,
COUNT(*) AS Calls,
SUM(DURATION) / COUNT(*) AS "R/Call"
  FROM INFORMATION_SCHEMA.PROFILING
  WHERE QUERY_ID = @query_id
  GROUP BY STATE
  ORDER BY Total_R DESC;
Which produces a rather more organized result as shown below:
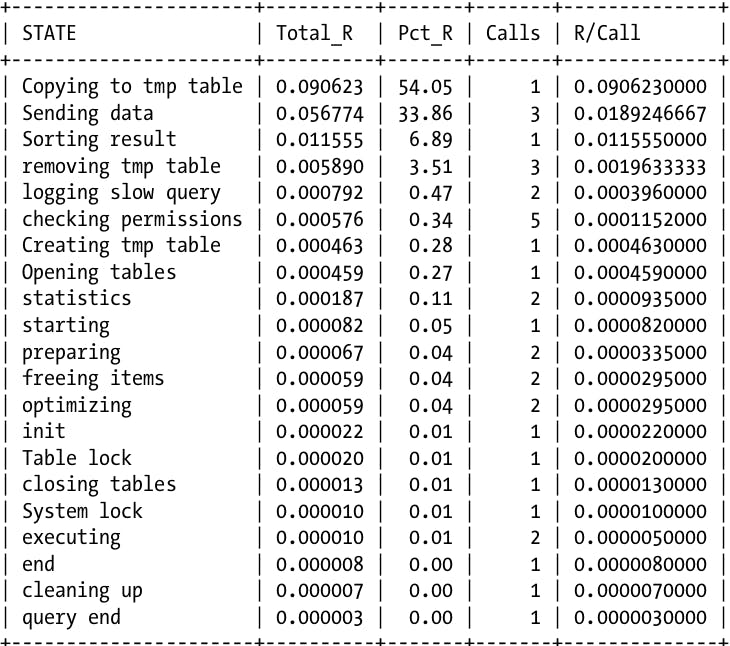
As we can see the produced result similar to the profile we inspected before which is a lot more useful, notice that now we have grouped all 5 instances of the operation "checking permissions" in a single entry and so on. This enables us to easily see that this query spent half of it time copying data to a temporary table. This also enables us to see which operations are worth optimizing, so maybe if we have had suspected that sorting by the primary index is causing the query to be slow, now we can see that sorting the result set only takes 6% of the total time and thus not worth optimizing.
SHOW PROFILE is quite powerful and it can show a lot more data beyond just response times, it can show block I/Os, context switches, CPU utilization, IPCs, memory pressure, page faults, swaps, etc. For a full documentation, refer to MySQL docs here.
It's worth mentioning that SHOW PROFILE isn't the only profiling method MySQL natively supports, there is also SHOW STATUS which shows global counters and can offer more insights and be complementary to the profile we generated above. A full documentation for SHOW STATUS can be found here.
Optimization via Profiling
Having obtained the query profile with its detailed breakdown of tasks, the authors say that optimization should be obvious, but I tend to agree to some extent. The profile can show you if a query creates a temporary table for example and then you can focus your efforts into what causes the temporary table to be created and how to get around that. It can show other problems like un-indexed reads, lock contention, etc. which will help direct your optimization efforts a lot more even if you currently don't know how to eliminate those.
Profiling Case Study
The book ends chapter 3 with an interesting case study of a system the authors were consulted to diagnose. The problem is as follows:
The customer complained that once every day or two, the server rejects connections with a
max_connectionserror and it lasts for a few seconds to few minutes in a highly sporadic manner.
The authors mention that this customer didn't attempt to fix the issue at all which made their life easier. Their arguments is that it's easier to debug a system that has not been tampered with or was subjected to any unknown changes (no weird trial and error debugging attempts.)
The debugging process went as follows:
- Get as much information about the system as possible starting with the basic information such as which
mysqlversion is running, what's the storage engine, what are the server specs, etc. This helps in selecting the proper tools to debug the problem and spot any known problems with certain versions. - Took a quick look and found nothing wrong with the queries.
- Installed their diagnostic toolkit and set it up to trigger on
Threads_connectedsince the connections problem will most likely be tied to that. They say, the average was 15 threads but during the incident the number of threads used to go up to several hundreds. - They recorded a wide range of statistics and profiles that I won't show here to keep this article short, but you can see them in the book.
- One of the important stats they recorded was the
read/writeactivity which showed a weird behavior as the server was writing hundreds of megabytes of data per second to the disks. After some calculations, it appeared that the server was doing around 150MB of writes per second but the whole database was only 900MB and the workload was almost exclusivelySELECTs. - They noticed that the main thread in innoDB was trying to flush dirty pages which only appear in the status if it was delayed. They knew that this version of innoDB suffered from a problem called furious flushing which happens when innoDB fails to evenly distribute flushing dirty page and instead forces a checkpoint to flush a lot of data all at once (sometimes called checkpoint stall). This seemed like a plausible explanation but it wasn't the problem. They verified that it wasn't the problem by running
SHOW STATUSand observing the number ofInnodb_buffer_pool_pages_flushedcounter which wasn't increasing that much. They mention this possibility to highlight the need for proving conclusions before getting carried away with what seems familiar. - After some more extensive debugging focused on this disk issue, it appeared that the cause of the problem is a storm of bad queries all at once saturating that disk and causing it to be very latent. The problem turned out to be on the application level as the application cache used to flush and many instances of the application were trying to repopulate it all at the same time causing what's known as a crash stampede.
- The authors then mention that a proper instrumentation on the application level or logging for such events (cache flush/cache re-populate) would have shown the problem easily and enabled the developers from solving it without a specialized database consultation as the database wasn't really the problem after all but rather the application.
References
High Performance MySQL: Optimization, Backups, and Replication
Previous Articles
Checkout previous articles in this series here: